DataPortal.online
“One picture is worth more than 1000 words” – is still an up-to-date Chinese proverb which in the current reality explains how to transfer information to the recipient effectively and simple. The primaeval man already knew that the painting on the wall of the cave would provide a summary of the events that had happened to him. Nowadays, in the electronic media era, a graphic image also more quickly speaks to us than text, which carries detailed and additional information. This is confirmed by the huge popularity of websites, where users share photos or videos with each other, and only after that are comments. Similarly, it happens with numbers. The graph is easier to analyze than a table with many data. Of course, it all depends on the type of analysis, and without a table, there would be no graph. One thing is certain, imaging the collected data or measurements and the appropriate presentation makes it much easier to analyze them. The first look at the graphic displayed on the screen immediately characterizes the present or past situation. In the next step, we are interested in details. Such a concept of observation occurs in all monitoring or control systems of industrial processes. The observer must immediately get information, e.g. about an alarm event or general installation status. This task is to be carried out by a new internet platform, complementing the telemetria.pl project. DataPortal collects data from telemetry modules, performs the requested analysis and provides results in the form of animated graphic images that will provide the observer expected information in the expected form. We invite you to read the following thousand words describing the details of your own… Telemetry Cloud.
Own Telemetry Cloud
DataPortal is, to simplify, a SCADA system accessible from an internet browser. It is a WEB server, displaying animated visualization in the browser. You log on to the appropriate page, and animated drawings appear on our computer or phone, allowing you to observe the current state of the monitored object or process. You can ask where is the cutting-edge technology in this? We start the server, we build a data-powered website, and it is ready. This is what the final effect should look like. It should be finally a tailored visualization on a website that is available wherever we have access to the network. We start the browser, log in and get the expected screens that provide the necessary information after the first look. The next step is a detailed analysis of information and action against possible irregularities. DataPortal is a place where exactly such a tailor-made system can be created. We do not need to buy servers or licenses, install software or develop a program in PHP, JavaScript or HTML.
The platform provides ready-made tools. Users of MT telemetry modules can use the portal for their implementations without the need for using other visualization systems. DataPortal is fully compatible with the project telemetria.pl. It supports all telemetry modules currently available in the Inventia offer. The service is embedded in “Cloud”, where after logging in you have access to management, design, and animation of created drawings in RUN mode. You start the adventure with DataPortal by creating a user profile.
User Profile
To create a user profile, first of all, a telemetry module is required. During the registration of the device, you create your account and the user with the administrative profile. The administrator account has access to all available functions. It can create additional profiles for users who want to access content or contribute to it. New profiles do not necessarily have full access to content. We have predicted several access levels defined in the system and available to administrators to grant rights with one click.
Such role is, for example, the Observer profile. It allows only logging into the project or projects with the created visualization indicated by the administrator. The content of the account can be expanded by adding additional devices, SIM cards, and additional services. Administrator permissions allow you to manage the added resources within your account. Only the data source is missing to receive measurement data from the added devices.
Devices or data sources
The device added to DataPortal requires a proper network configuration to correctly communicate with the “Cloud”. A correctly configured module is recognized on the base of the transmitted identifier. Data sent to DataPortal is received in an unprocessed form, i.e. we know what the device is sending, but we still do not know what final form we will adopt. Data Source is required to interpret received data in DataPortal. It is a complement to a physical device, an intermediary that provides information to DataPortal, marking it with its tag. The data source is created when adding the device to the “Clouds” resources.
The device and data source become connected. Thanks to such a procedure, the structure of measurement data in DataPortal is separated from the hardware layer. At any time, the account Administrator can disconnect the device from the Data Source and use the hardware for other purposes. The source still exists and can be powered by data from another device. The data supply is directly related to the data transmission.
Data transmission
DataPortal is directly connected to the telemetria.pl project. It is the easiest and fastest way to communicate in a secure, closed network. The “Cloud” itself provides tools for managing your SIM cards. Currently, it is possible to assign available cards to your devices. You can also check the remaining period of card activity and estimated data usage. You can choose from three operators who are a partner of the telemetria.pl project.
We have also predicted other methods of providing data that are not yet available in the interface. They can be included on special request. Meanwhile, when the SIM card is already plugged in the device, the logged module transmits data, and you have a connection card-device-source in the Cloud, it is time to check if and what data you receive.
Raw data (RAW)
It is time to choose the resources you want to monitor. Telemetry modules send events, contents of the recorder or answer queries. In any case, they are numbered registers or bits. DataPortal receives data unprocessed by default. Data received from an event or recorder is presented in decimal or binary format. It is up to the user to decide which values are to be archived and in what form. Some may require rescaling, others may represent a real value only after the appropriate “assembly” (e.g., a floating point variable covers a few registers), others are to be in binary form, and we receive them in decimal form.
The data received by DataPortal in the RAW format gives a preview of what the module sends, whether the received data is expected, or perhaps there is too little or too many data. Having a preview of the raw data, we are close to the values calculated by the specified measurement variable format, i.e. a single TAG.
TAGs and Data blocks
This is what we called a single variable that introduces the current value into the system and is recorded in history. The TAG configuration allows you to specify its type, i.e. whether the value should be an integer with the sign, maybe it is a floating point variable, how many registers it contains, or maybe it is a plain text. Depending on the type chosen, we can specify additional options, e.g. specify scaling conditions to process the received values according to a specific pattern. The alarm settings are also indirectly associated with the TAG type. DataPortal for indicated TAGs can automatically detect alarm situations, collect them and display even when a given status no longer exists. Alarms can be presented on dedicated controls described later.
Returning to TAGs, we currently distinguish five types:
REAL – data coming from physical devices are saved in history, their current value is available on an ongoing basis.
VIRTUAL – unrelated to devices, store data entered from the visualization level, are saved in history.
PROCESSED – recalculated data whose value is the result of mathematical operations performed, where the arguments are other Real or Virtual TAGs.
LOCAL – unrelated to devices, they store temporary data, derived from the processing of real or virtual TAGs, but only when we are looking at drawings; the current value is not archived.
PLACEHOLDERS – indicators for other TAGs, dynamically changed when running twin visualizations displaying data from many objects with the same structure in the same figure.
The correct interpretation of incoming data from devices is possible only when the TAGs have the correct settings. DataPortal provides a preview of the current processing results, and when it is necessary, adjustments and re-verification are possible. TAG values are processed from regular event-sent data from internal device recorders as well as from classical time-repeated query. Repeat query exists temporarily in “Cloud” and is named Block Date. The definition comes down to determining what kind of registers we want to query, with what period. DataPortal polls the indicated source with a relevant query receives a response from the source associated with the device performs the requested conversions and provides the resultant value according to the definition of the TAG. The values are added to the history and transmitted as current to the Project related to the TAG.
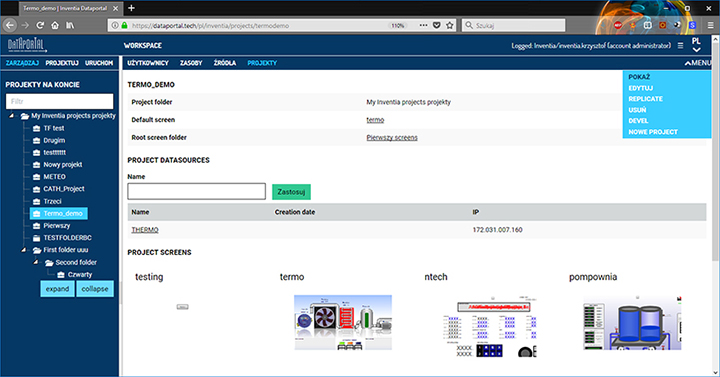
Projects, Screens
The project includes Users and Data Sources with TAGs. A project is a set determining the membership of individual elements of the visualization system. It also contains, and first of all, animated screens, which in addition to graphics have a direct connection to the current and historical values of specific TAGs. The project combines all the elements enabling the use of received information on animated drawings, diagrams or detailed tables.
The project can be assigned to specific users and thus becomes available to them. One of the screens in the project can be selected as a startup. In this way, we get a user profile, which after logging in starts a properly prepared screen from which you can navigate through the entire created visualization.
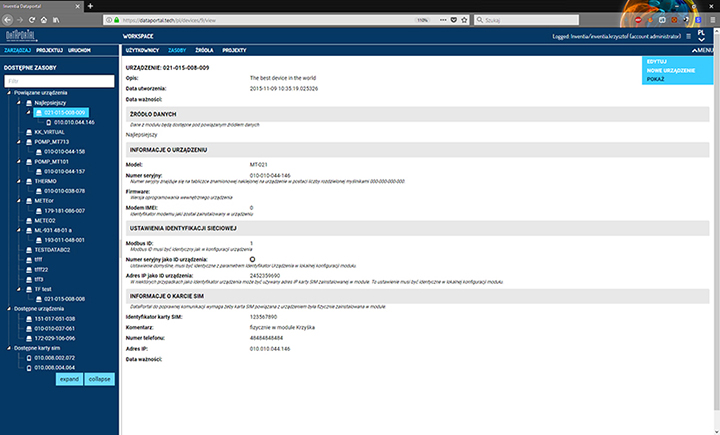
Creating in DataPortal Designer
After switching to the DataPortal designing mode, it launches a tool that allows drawing screens that will be displayed as animated to the logging users. The Designer is an editor that allows you to create vector graphics of different complexity. Also, it is a tool for reviving them based on data from previously prepared TAGs. The developer has a workspace for creating drawings that will become synoptic screens. All basic options such as save, copy, group, etc. are available directly from the basic menu.
The functions for creating visualizations are available on dedicated panels, whose visibility and position on the screen can be controlled depending on preferences. Once launched, Designer presents a system demo screen or an empty workspace, depending on the choice. We start creating the first or next screens in the Project.
Drawing Screens
We start by determining the size of the drawing and its proportions in the WORK AREA panel. At this point, we also have the option of selecting the UI (user interface) style for displaying preset controls (their description is in the following text) and selecting the background of the area in the form of any drawing or solid color. Graphic objects and controls are available after invoking the TOOLBOX panel. Simple functions such as drawing a line, a circle, a rectangle or any path give you an introduction to creating any graphic. An essential element is also the option of inserting text and external graphics. The toolbox also provides complex elements, such as an alarm counter, various buttons, and an animated indicator.
After selection, these elements require adjusting their appearance or operation to match the expectations by modifying their properties available on the panel with the same name. The toolbox also provides advanced elements that additionally have their windows with settings available after double-clicking the added control in the workspace. On the other hand, advanced elements are nothing but ready-made controls, for example, a chart which external appearance depends on the chosen UI style.
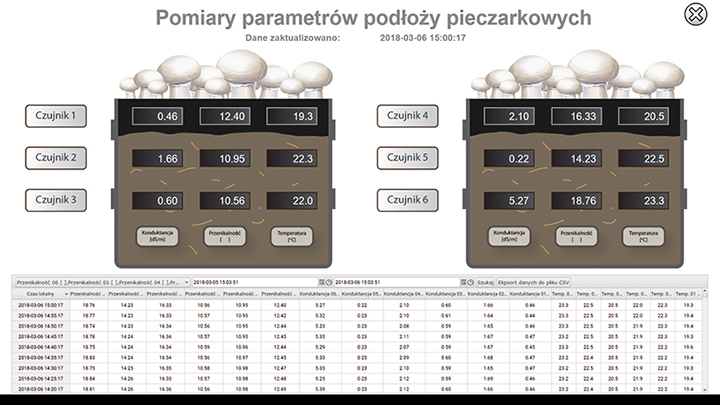
Graphs and Tables
A single control can take the form of one of four available graph types: linear, columnar, point (XY) and Gantt. Regardless of the type selected, the user influences the control’s appearance and its behavior by changing the settings on the PROPERTIES panel. For convenience, we have divided the settings into groups: General, Axes, Style. Each of them contains parameters, the change of which allows you to adjust the control to your own needs. For correct operation, the selected type should be equipped with pens that will present values from the indicated TAGs. Each pen can be edited independently. The control displays the current trends in the automatic refresh mode. In the properties, you can choose to work with archive data. In historical mode, the trend display control is done manually by the user. Data presentation is static according to given time criteria. The change in the approximation is manually triggered, thus completing the missing measurements.
The Graph control is complemented by a Table that also displays current or historical data for connected TAGs. The table is independent but can be paired with the Graph control. Such configured Table control is automatically filled in with data currently displayed in the Graph. The table allows you to export your content to a local computer disk with one click. The downloaded data can be used for further analysis in other programs. The table also has simple functions for calculating mean values, totals, and differences for displayed data. There is no limit to adding multiple graphs or tables in one project. A specific type of table control is Alarm Summary.
Alarm handling
A summary list of alarms is used to display and manage alarms in the project. The control automatically displays alarms according to the configuration of the related TAGs. Alarms can be confirmed, deleted and commented with your own text. When creating a screen in the settings of the alarm summary, you can delete or add columns and auxiliary counters displaying the total number of states in which individual alarms are located.
The summary also allows you to play audio signals when an alarm situation occurs. The complementary element is the alarm counter control. It is foreseen for inserting into drawings, where it is not envisaged to place a table. Thanks to this, the user will always be informed about the occurrence of a new alarm regardless of the currently displayed screen. The alarm counter also plays back sound signals.
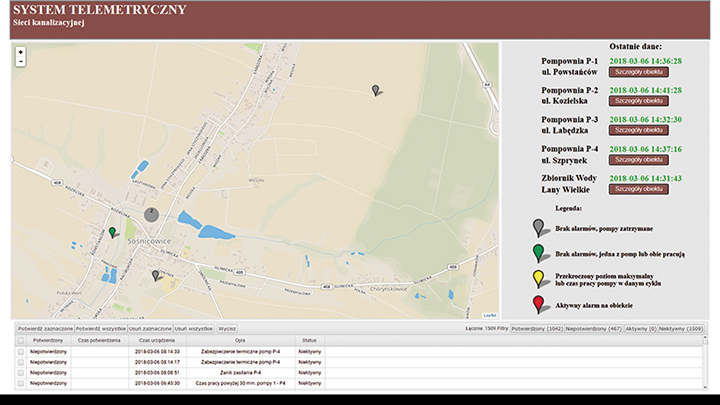
Let's show it on the Map
The MAP control displays in the RUNNING mode an active map with marked locations of monitored objects. During the configuration of the control, you can set the initial view of the map, the start position, and apply and personalize the location markers. The color of the markers is animated and describes the current situation of the object. The marker can simultaneously be a shortcut to detailed data. The map is ideal as an element of the start screen in distributed monitoring systems, where the location of objects is scattered in the field.
Map configuration also provides the option of placing markers of moving objects. The Map control and other elements of the toolbox have some configuration parameters to be modified on their PROPERTIES panel. Like markers, the controls can be animated in the RUN mode using properties settings, depending on the imposed conditions.
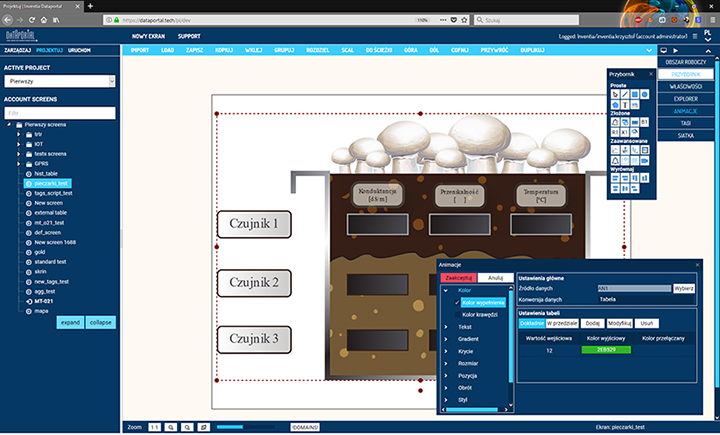
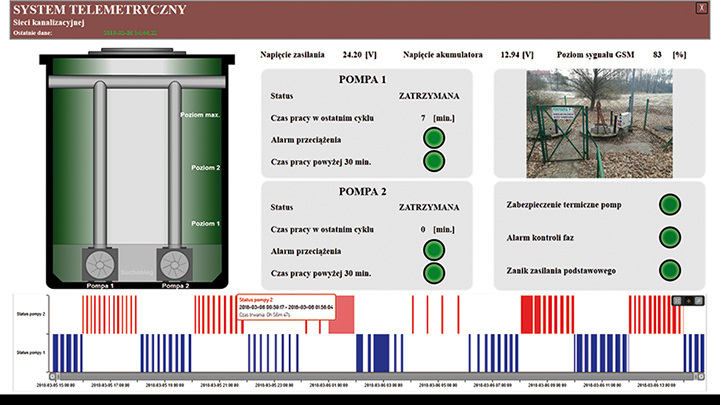
Animations
Following animations are at developer disposal: color and gradient, text, transparency, sizes, style for the objects used, position in the work area, object rotation and percent fill. Any combination of using the available options is possible. It all depends on the invention of the person creating the screens. You can create any number of screens in the project. Navigating between them, switching screens or calling a pop-up window with another screen is also treated as the animation. DataPortal provides ready-made scripts that allow you to create visualizations of many levels.
Among them are also ready-made scripts for updating data on demand or for sending control commands to be delivered to remote devices. When designing, you can test your visualization at any time by putting it in motion. Such an instant preview gives the developer the answer whether the expected effect he wants has been achieved. The animated mode is a separate layer of DataPortal. During design, you use it only for testing and diagnostic purposes.
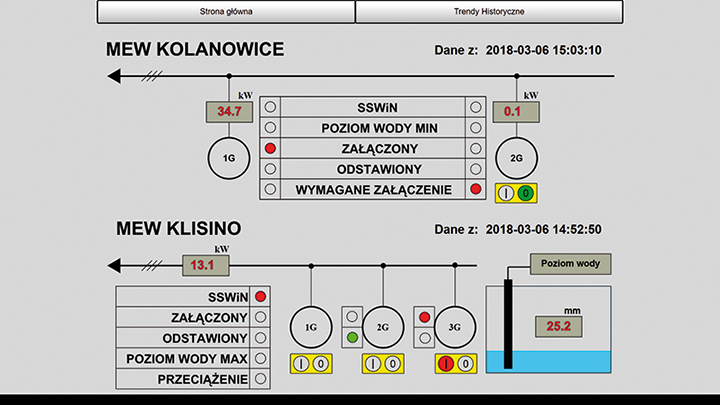
RUN visualize
When the visualization project is completed, the data from the objects are flowing down, and the animated elements are displayed correctly, it is time to move to the RUN mode. This is the final form that will be available to the user with a normal profile, e.g. an observer. After logging in, DataPortal will immediately start the project in the animation mode and present the screen selected in the project as a startup. Navigating the visualization will be consistent with the will of its developer. However, the user profile may limit certain privileges, e.g. the ability to control or acknowledge alarms.
Each user, regardless of the profile, can set the RUN mode as start mode and immediately after logging in, get direct access to the live visualization.
This is how the visualization in DataPortal looks like in a nutshell. However, this is not all. We hide more possibilities in the cloud. They are not directly related to visualization, but they complement the service’s potential.
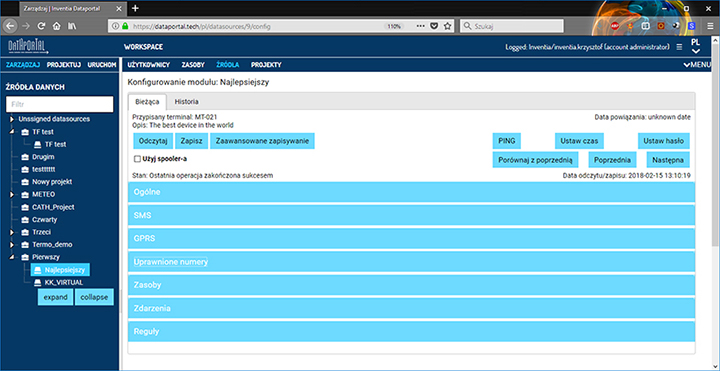
WebMTC
DataPortal Cloud is not just a visualization. We have also embedded in it the tools designed to change the configuration of connected devices. The configuration method and its form were taken from the MTC program, which we provide in the form of a local, quick configurator installed directly on the computer. The network version of webMTC currently embedded in DataPortal allows only the configuration without the possibility of programming (at the moment). In the network version, you can modify almost all parameters that are available in the modules, bypassing those responsible for logging the device to the GSM network.
We provide full read and write of configuration, the ability to synchronize time, and the access to devices with a password. We also support the operation of battery devices that have the function of reporting to the MT-Spooler service, which is also implemented directly in DataPortal. The whole history is also completed by the configuration changes history, which was carried out using the Cloud level. Saved historical configuration images can be described, viewed and, if necessary, loaded into the currently connected device or used in the future to massive instant updating of multiple devices.
Data hosting in DataPortal
Maybe we do not need visualization; just Excel is enough or we have our data analysis or presentation software?
DataPortal is prepared to collect large amounts of frequent measurements. Data acquisition from devices is carried out in RAW mode and processed form as TAGs. Data can also be registered without the need to build a synoptic. We predicted a few ways of accessing archives collected by DataPortal. This option is designed specifically for the needs of customers who want to take advantages of telemetry but accustomed to their systems of visualization or programs.
Possible forms of data distribution to the customer:
DATA REFORWARD (ROUTER LESS) – a service data transfer from telemetric devices without the need to use the gateway or access router to telemetry.pl. DataPortal acts as a Router and becomes a telemetry gateway. You only configure data sources and local telemetry system, where you receive data via MT-Data Provider.
RARE EXPORT – collected data is available in the form of CSV, XML or JSON files according to the set time interval. Data is exported to the FTP server provided by the user. This method requires TAG configuration as well because the data in the files are fully processed.
OPC UA SERVER – DataPortal becomes an OPC server in UA architecture. Customers can connect to the server using a secure encrypted channel. The server provides data according to the configuration of data sources and connected TAGs.
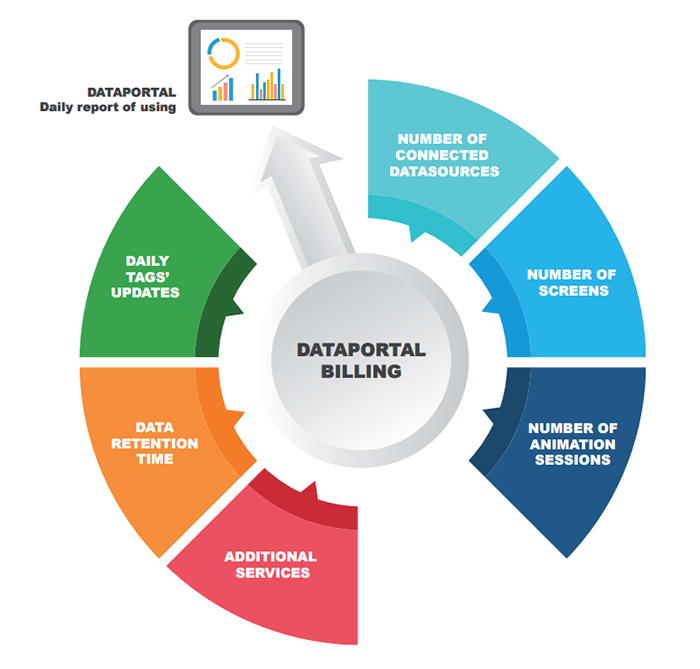
Billing
The costs of using DataPortal depend on several factors described later in the text. The sum of each factor costs determines the daily load. In general, we have adopted a daily model for the settlement of costs, i.e. once a day the use of resources is reduced and the limit of available credit is reduced. The credit is expressed as the amount of virtual currency Vcoin. The resources of Vcoin can be supplemented directly from DataPortal. Depending on the visualization model that you chose, each project will generate different loads.
The elements affecting the daily invoice include:
SCREENS – we count the number of animated screens created. This is done once a day. The user, while adding screens, has a current preview of the current costs that will be charged to him at the end of the day, so unnecessary screens can be deleted and will not be included at the end of the day.
DATA SOURCES – counting data sources is done just like screens. All data sources are counted. There is no limit to the number of devices or SIM cards.
ACTIVE SESSIONS LAUNCHING – we count simultaneously run sessions of the RUN mode. However, the number of users created within the account is not significant. The number of simultaneous sessions is counted per account (we also enable logging in from many places with the same login). We check the number of sessions online and display an appropriate message for the user who is trying to start the RUN mode above the available limit.
DATA ARCHIVING TIME – the duration of data storage is determined relative to the entire account and is counted in days. All TAGs have the same retention period regardless of the frequency of updates. Data that will go beyond the time limit you have bought is deleted. After extending the time limit, new data fill the increased space to the new threshold. After reducing the time limit at the end of the day, the data from outside the range is marked for deletion. The deletion of data takes place at the moment of calculating the daily invoice.