.

DataPortal - How can data visualisation make your work easier?
Find out:
- How do you intuitively streamline the visualisation process?
- Why use the Data Portal? Find out its biggest advantages
- Do your visualisations scale without losing quality? Opt for SVG vector graphics!
- Real-time data through How does real-time visualisation affect responsiveness and support decision-making?
- Animation of objects for better interpretation of data
- What allows you to react more quickly to potential threats? Setting alert levels
- DataPortal in action – application examples worth exploring
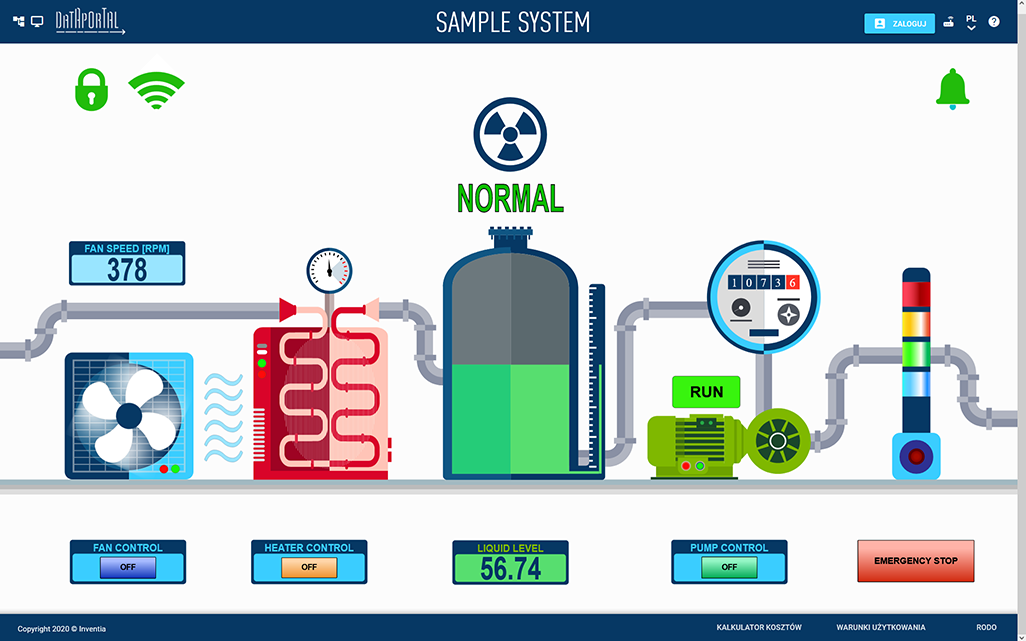
In today’s world, where the volume of data provided is enormous, the ability to process it quickly and efficiently is becoming extremely important. Data visualisation has become one of the most powerful tools in the hands of managers, engineers or employees responsible for monitoring and managing data. In this context, SCADA (Supervisory Control and Data Acquisition) systems play a key role in collecting, monitoring and analysing data in real time. DataPortal is an innovative, web-based solution that enables the creation of interactive visualisations of data, delivered from telemetry modules, in an easy, intuitive and functional way. See how visualisation can revolutionise the way you manage your data and processes.
How do you intuitively streamline the visualisation process?
An intuitive solution to streamline your visualisation creation process. DataPortal offers an extremely simple and intuitive graphical editor that allows you to quickly create visualisations. With it, you can easily design interfaces for process monitoring, creating animated synoptic screens that present data in graphical form. All you need to do is drag the relevant objects onto the screen, adjust their properties and assign the appropriate tags. Thanks to the availability of ready-made templates and object libraries, the process of creating a screen is quick, without the need for advanced programming knowledge.
Why use the Data Portal? Find out its biggest advantages:
Security – the system runs in a secure cloud environment to ensure stability and data protection.
Flexibility – ability to access from any device with a web browser, regardless of operating system.
Economy – no need to invest in your own hardware infrastructure and software licences.
Ease of use – an intuitive interface and vector graphics editor allow quick creation and personalisation of screens.
Do your visualisations scale without losing quality? Opt for SVG vector graphics!
One of the greatest strengths of the DataPortal system is its support for vector graphics in SVG format. What does this mean in practice? First of all, your visualisations will be clear and sharp, regardless of screen resolution or device size. This is crucial if your visualisations are to be displayed on a variety of devices – from small smartphone screens to large monitors in dispatch centres. Vector graphics do not lose quality even when zoomed in, ensuring excellent readability in any case.
How does real-time visualisation affect responsiveness and support decision-making?
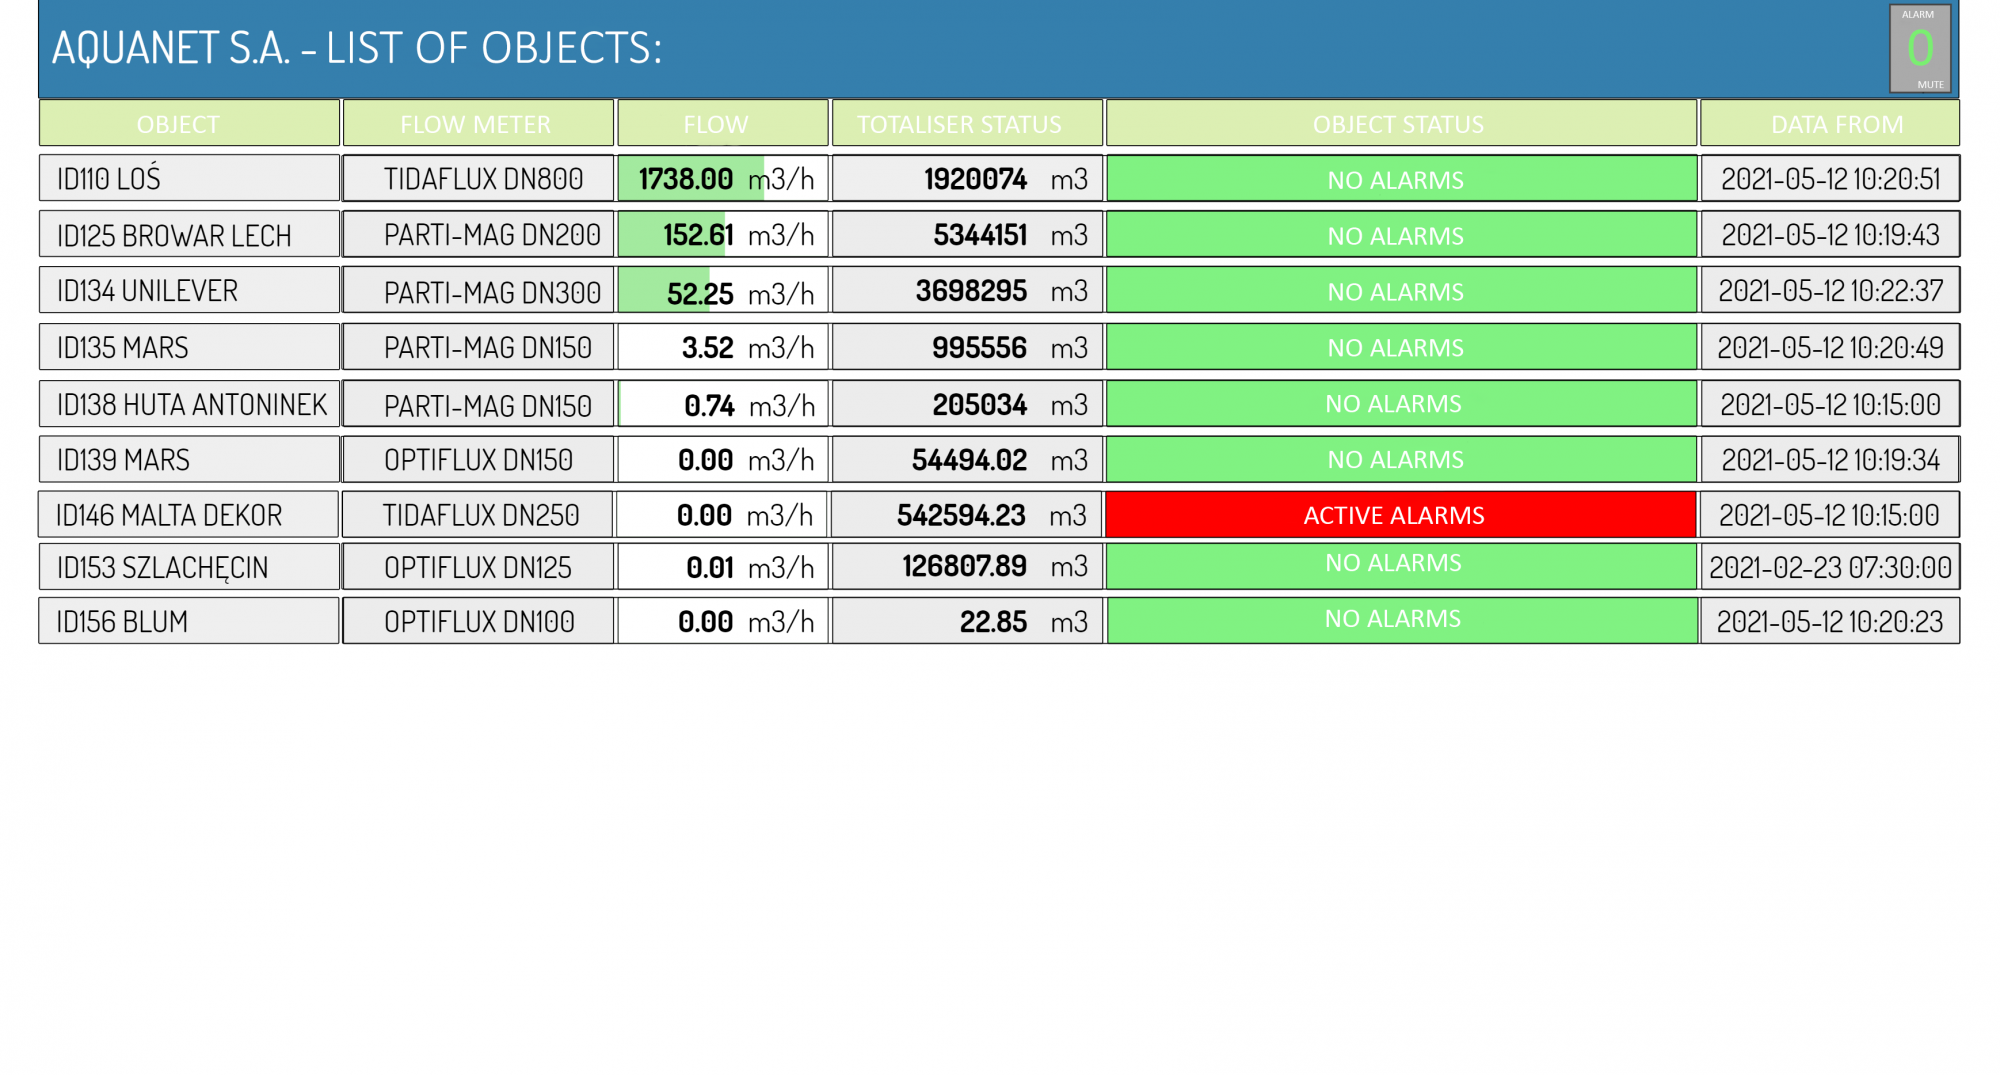
DataPortal not only enables visualisations to be created, but also allows them to be dynamically updated in real time. Thanks to the integration with measuring devices, the data collected by the systems is immediately processed and presented in graphic form on synoptic screens. This means that you can check the current status of your processes at any time and detect anomalies, which has a significant impact on the speed of response and decision-making.
Animation of objects for better interpretation of data
In DataPortal there is a function for animating objects on the screen using tag values. With this option, you can easily see how data changes over time. For example, if you are monitoring temperature, pressure or water level, the change in these parameters will be immediately visible as an animation, making it easier to interpret. In addition, creating and modifying tags allows you to easily assign different values to objects, making the entire visualisation more interactive and readable.
What allows for a faster response to potential threats?
Another functionality that makes work significantly easier is the ability to set alert levels. With this option, you can define alarm thresholds that, if exceeded, will automatically trigger notifications. For example, if the water level in the tank exceeds a certain value, the system can send an alert, allowing you to react more quickly to potential threats. This is ideal for monitoring systems where a quick response can prevent a major emergency.
The Data Portal in action - application examples worth exploring
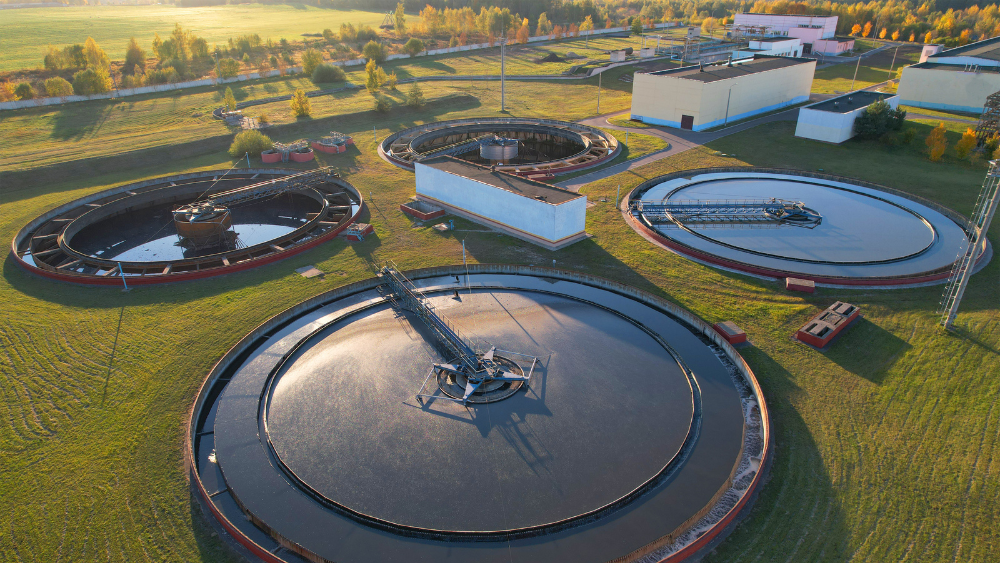
Water and sewerage industry:
- Control and monitoring of hydropower plants and sewage pumping stations – Data Portal enables the effective management and monitoring of water and wastewater facilities, providing visualisation of data collected in real time using the MT-121 module.
- Liquid parameter monitoring system – allows continuous monitoring of water quality and control of accepted standards. Notifications are generated directly from the DataPortal platform and distributed to authorised operators.
- Graphical water consumption reports presented in DataPortal – enable efficient analysis of water consumption data based on remote water meter readings.
Energy industry:
- Monitoring of generated electricity – in wind power plants and photovoltaic installations DataPortal helps to effectively monitor energy production.
- Predictive monitoring of electrical switchgear – Platform DataPortal provides early warning of potential technical problems, allowing rapid intervention.
Other sectors:
- Surface and groundwater level monitoring – DataPortal enables monitoring of water levels in different environments, which is important for water resources management. Data collection can be carried out by using the MT-718 or MT-058 module.
- Monitoring of leaks in the installations of the district heating system through the MT-156 device, which collects data and enables its analysis directly on the platform DataPortal , allowing the rapid detection and repair of failures, thus contributing to the reduction of energy losses.
- Lignite mining data distribution – DataPortal enables the efficient distribution of data between different locations around the world.
- Monitoring mushroom cultivation – The DataPortal platform, supported by the MT-331 module, collects temperature and humidity data, which are analysed in real time. This makes it easy to control growing conditions, ensuring optimum efficiency and mushroom health.
DataPortal is a platform that combines advanced functionality with ease of use. With the ability to create scalable visualisations, animate data, set alarms and easily integrate with other systems, it becomes an indispensable tool for working with data. Regardless of your industry, whether monitoring industrial processes, managing infrastructure or controlling automation systems, DataPortal helps you realise the full potential of data visualisation for faster and more effective decision-making. It gives you full control over your data and processes in real time, thereby protecting your company from losses.
Share this article:
Read more articles:

Migration of telemetry systems. Evolution from MT-101 to MT-121
Discover the benefits of migrating from MT-101 to MT-121 in telemetry!
")
How is the Internet of Things (IoT) revolutionising
industries such as manufacturing, energy and agriculture?
Discover how telemetry technologies in the IoT
can revolutionise your business