


DataPortal – system’s update
Dear Sirs, We would like to inform you that, we have introduced changes to the functionality of the DataPortal system improving your experience with it.
Following the implementation of the changes, the DataPortal platform received a new type of variable called the ‘calculated tag’. It provides the ability to build a calculation formula and archive its results. This functionality allows data from different sources to be combined, going beyond the non-standard
mechanisms of data presentation systems.
Here are some key benefits of the new type of variable:
- Calculation of values based on a defined formula, allowing the use of multiple variables and constants
- Ability to define alarms depending on the result of these calculations
- Creating of notifications (e-mail, SMS) to the defined alarms
- Presentation of the result over time on various types of graphs
- Presentation of the calculation history in the form of a Table type object
- Using the result of the calculations on synoptic screens and reports


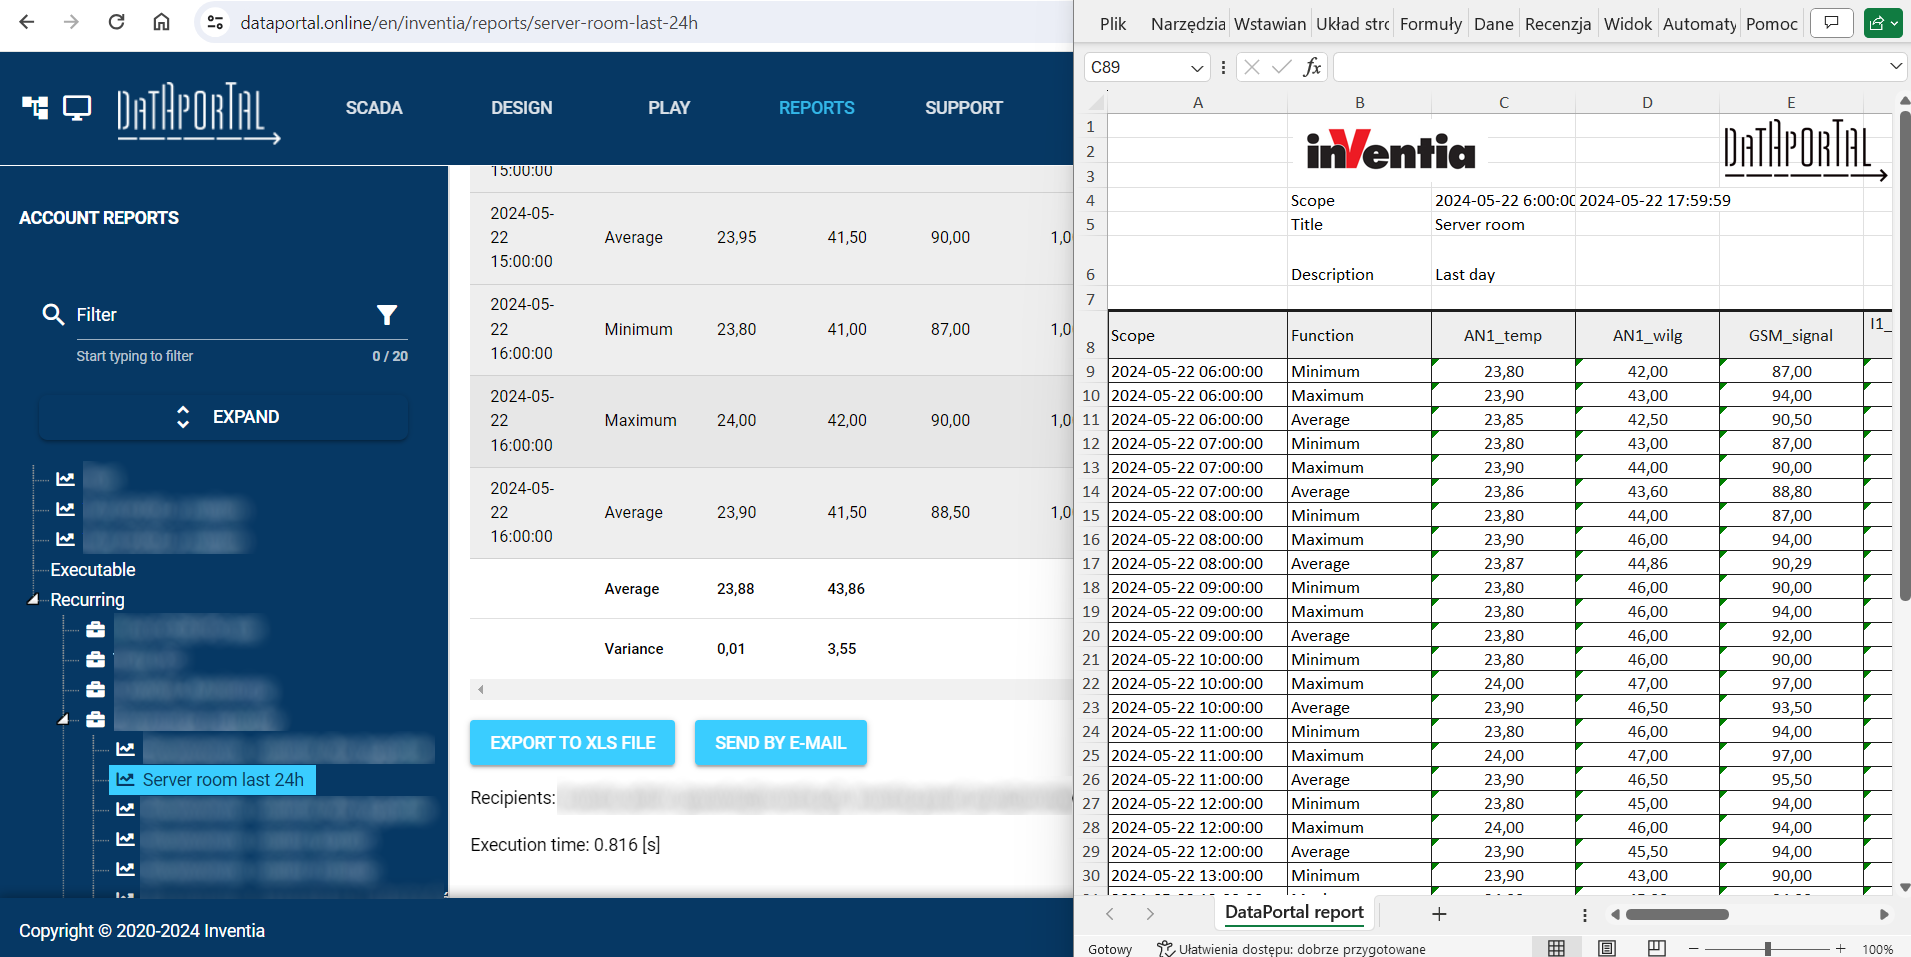
As part of the ongoing changes, we have prepared a new release of reports on the DataPortal platform. This is another tool in the system that will enrich your analysis and improve your decision-making process. Reports facilitate collaboration and provide better control over processes.
The new power of data analysis with DataPortal:
- Enable account administrators to create and edit report templates
- Provide operators and observers with a preview of generated reports
- Reports can be opened from synoptic screens
- Reports can be downloaded to the local drive in form of MS Excel spreadsheet
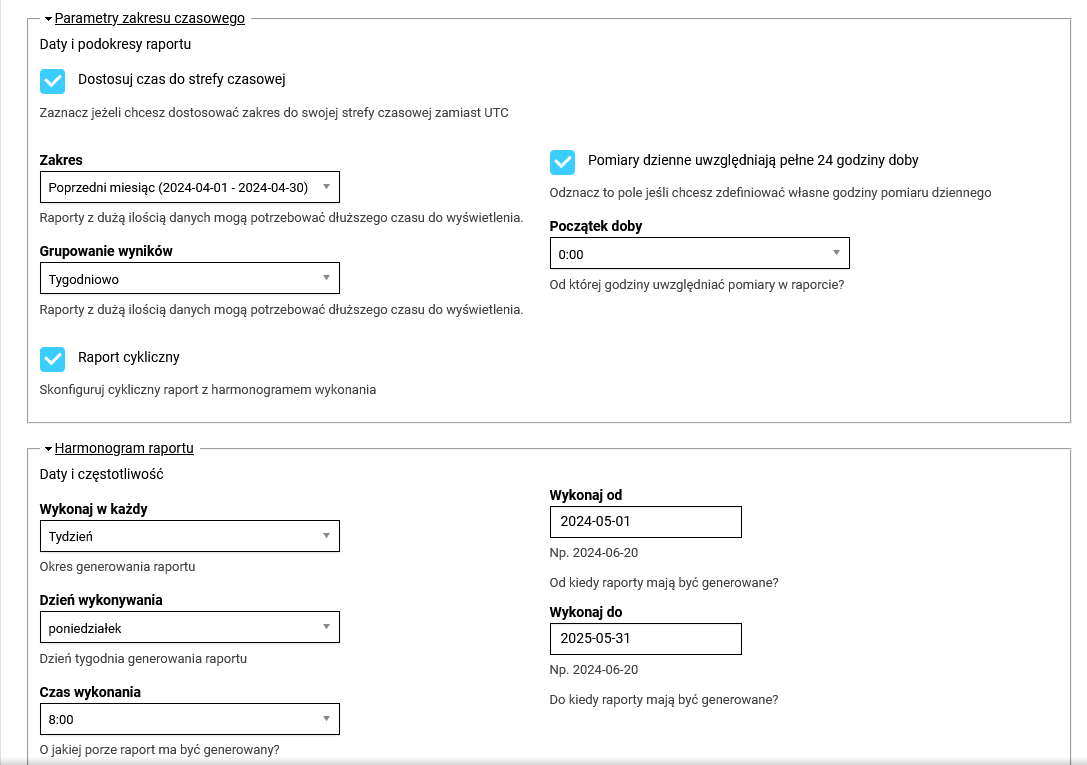
- Distribute reports by e-mail according to a pre-defined schedule
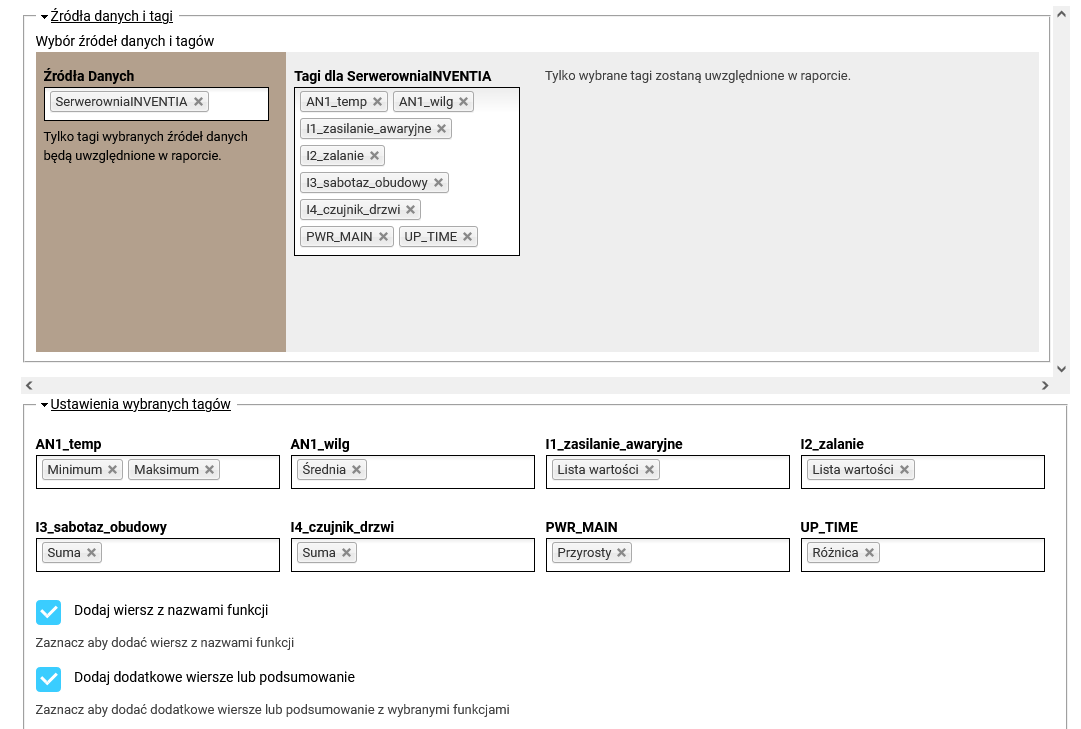
- Present data in the form of a table with a variety of aggregation functions, providing the possibility of grouping data according to predefined time intervals.
- Build reports not only on the basis of variable values obtained from remote objects – also use calculation tags, which are calculated on the DataPortal platform
- Synoptic screens are not required to generate reports
New possibilities of platform personalisation!
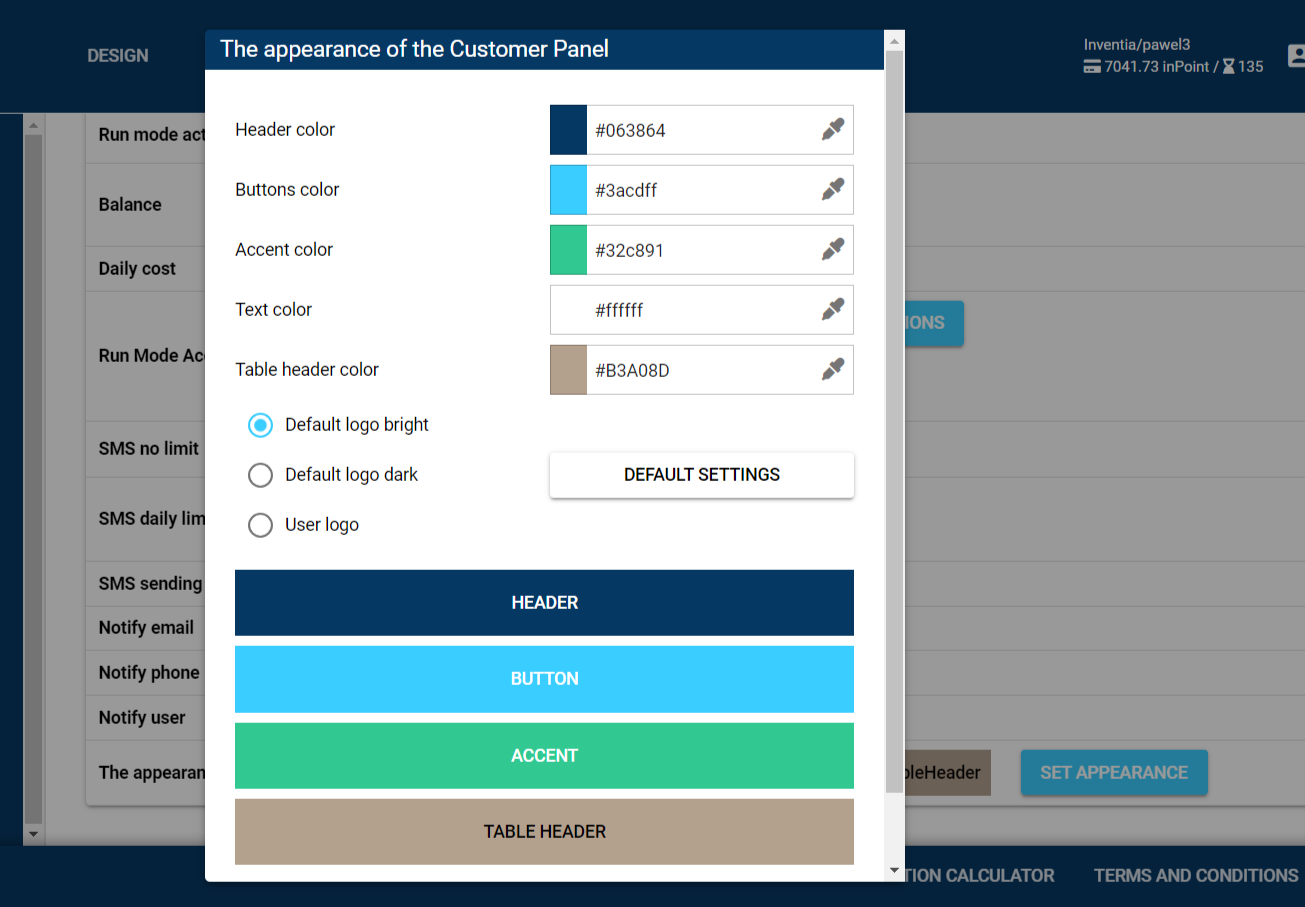
Giving the Customers more control over platform design – introducing rebranding option!
It is now possible to:
- Customise the platform colour scheme to match your brand – all colours of the RGB palette are available
- Add your own logo to personalise the platform and make it more recognisable